
Page 123 - Bank Muamalat_AR24
P. 123
ANNUAL REPORT 2024 1 2 3 4 5 Sustainability Statement 6 7 8 121
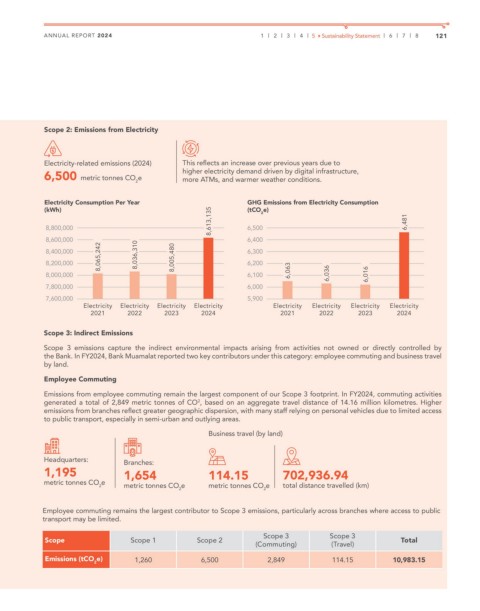
Scope 2: Emissions from Electricity
Electricity-related emissions (2024) This reflects an increase over previous years due to
higher electricity demand driven by digital infrastructure,
6,500 metric tonnes CO e more ATMs, and warmer weather conditions.
2
Electricity Consumption Per Year GHG Emissions from Electricity Consumption
8,613,135 6,481
(kWh) (tCO e)
2
8,800,000 6,500
8,600,000 6,400
8,065,242 8,036,310 8,005,480
8,400,000 6,300
8,200,000 6,200
8,000,000 6,100 6,063 6,036 6,016
7,800,000 6,000
7,600,000 5,900
Electricity Electricity Electricity Electricity Electricity Electricity Electricity Electricity
2021 2022 2023 2024 2021 2022 2023 2024
Scope 3: Indirect Emissions
Scope 3 emissions capture the indirect environmental impacts arising from activities not owned or directly controlled by
the Bank. In FY2024, Bank Muamalat reported two key contributors under this category: employee commuting and business travel
by land.
Employee Commuting
Emissions from employee commuting remain the largest component of our Scope 3 footprint. In FY2024, commuting activities
generated a total of 2,849 metric tonnes of CO , based on an aggregate travel distance of 14.16 million kilometres. Higher
2
emissions from branches reflect greater geographic dispersion, with many staff relying on personal vehicles due to limited access
to public transport, especially in semi-urban and outlying areas.
Business travel (by land)
Headquarters: Branches:
1,195 1,654 114.15 702,936.94
metric tonnes CO e
2 metric tonnes CO e metric tonnes CO e total distance travelled (km)
2 2
Employee commuting remains the largest contributor to Scope 3 emissions, particularly across branches where access to public
transport may be limited.
Scope 3 Scope 3
Scope Scope 1 Scope 2 Total
(Commuting) (Travel)
Emissions (tCO e) 1,260 6,500 2,849 114.15 10,983.15
2